Mid-year review shows early signs of improvement
In recent years, with regard to the sport’s ability to stage consistently competitive racing, we have witnessed a steady decline in certain key performance indicators, such as horses in training, average field sizes and races run with fewer than six runners. However, the first six months of 2015 are showing signs of improvement, writes Antonia Newman.
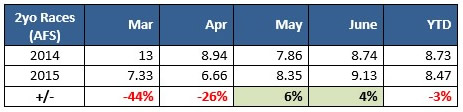
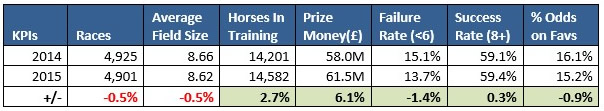
The average number of horses registered in training per month is up by 2.7% on 2014 (at 14,582 from 14,201). This includes a more modest increase to the Jump horse population (up by 0.4%), which represents a reversal in the trend towards decline over the last five years. In particular the two-year-old horse population on the Flat has increased substantially from 2,894 to 3,079 (+6.4%), and whilst there were early concerns over juveniles not making it to the track, field sizes in two-year-old contests have swelled by over a third since the beginning of this year, and are now ahead of similar races in 2014 for May and June.
How did 2yo races in 2015 fair against 2014?
To date, there have been 107 fewer Flat races run in 2015 (largely resulting from the race reduction measures introduced throughout the January to March ‘pinch point’ period), whilst fewer fixture abandonments this year has resulted in 83 more Jump races being run. With the horse population still in limited supply, this has had an effect on the average field size which is down to 8.44 over Jumps (-2.1%) but up by 0.8% at 8.75 on the Flat; leaving us on a par with 2014 overall.
The rate of non-runners is also down significantly on 2014 (-8.7%), and is lower than in any other previous year compared in the data pack (excluding 2011 on the Flat). Please see last month’s blog (https://www.britishhorseracing.com/may-field-sizes-and-focus-on-non-runner-rates/) for more information on this.
Prize money is also at a record high of £61.5m, signifying a 40% increase on 2011. We have more terrestrially televised races too at 293 races up from 277 in 2014 (+5.8%).
Crucially, the number of races failing to attract six or more runners (commonly referred to as the failure rate) has also decreased from 15.1% in 2014 to 13.7% overall, with improvement shown over Jumps (-1.1pp) and on the Flat (-1.7pp). In addition to progress being made in field sizes, it’s pleasing to see that the percentage of races run with odds on favourites is also down at 15.2% from 16.1% in 2014.
The table below compares some of the key performance indicators in 2015 against 2014.
Download the Data Pack
The latest monthly data pack covering the period from 1 January to 30 June can be downloaded here: https://www.britishhorseracing.com/resource-centre/reports-and-statistics/racing-data-packs/