2018 – When the going got tough
 For many, 2018 will be remembered as the latest in an infrequent list of sizzling summers after 1976 and 1995. However, for many in racing it was just the latest period of adverse weather which affected our sport, writes BHA Racing Analyst James Follows.
Last year saw an unprecedented fluctuation in conditions from spring to summer. By the end of April, there had already been 55 Jump fixture abandonments, more than the combined total of abandonments in the whole of 2017, and a further 14 abandonments on the Flat. In the early part of the year, the Beast from the East froze much of the country before waterlogging seriously affected the beginning of the Flat turf season where due to cancellations there was a two-week period where all turf fixtures were abandoned.
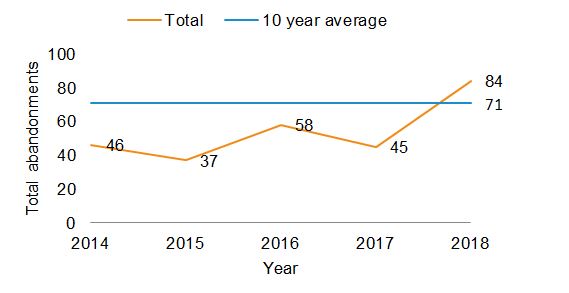
Total abandonments against previous 10-year average, by year
The below graph helps to demonstrate the volatility in going conditions during the year. The purple area represents the path of 2018 against the previous 5-year average in blue. The spring period, in particular weeks 10 to 18, demonstrate the waterlogged conditions where fixtures were either abandoned or run on predominantly heavy/soft ground. Hence why the purple line is well below the 5-year average (blue area).
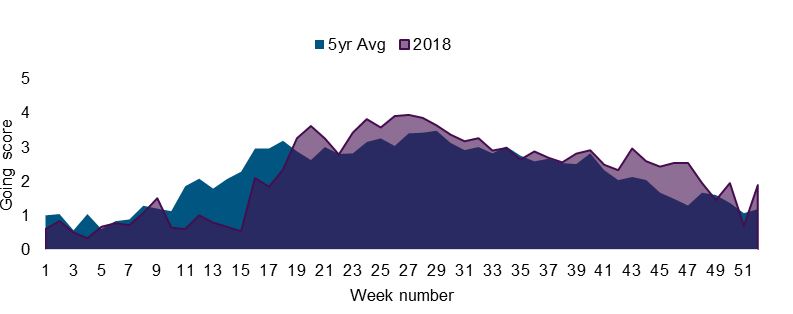
Going score by week in 5-year average v 2018
| Key |
| 5 = Firm |
| 4 = Good to Firm |
| 3 = Good |
| 2 = Good to Soft |
| 1 = Soft |
| 0 = Heavy |
Astonishingly, the reverse is true by week 19. In contrast to the start of the year, the height of summer saw turf racing take place on almost exclusively good to firm ground or firmer. The lack of rain continued throughout the remainder of the year and impacted the start of the Jump season. Weeks 43 to 47, representing the end of October and November, saw far firmer ground than would usually be anticipated heading into the time of year when flagship Jump festivals are welcomed back into the fold.
It is important not to underestimate the knock-on effect of going changes, which is one of, if not the most important of considerations which affects the participation of runners.
Despite the high number of abandonments, more fixtures than ever were staged in 2018. This was due to three main reasons. There was already a slight increase in the scheduled fixture list, an increase of 11 from 2017 were programmed following the fixture list consultation process with stakeholders. Secondly, during the high abandonment period in the early part of the year, the BHA, with support from the Levy Board, organised additional fixtures to ensure horsemen were given opportunities despite the prevailing conditions and also to keep racing going through the bad weather. These resulted in both Jump turf meetings being replaced where possible, additional Flat all-weather meetings to help sustain the sports’ income and for the first time since 2014, the programming of ‘jumpers’ bumpers’ to give Jump horses opportunities to race when there was no chance of turf racing.
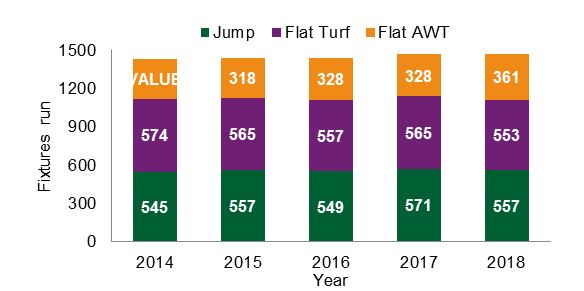
Total fixtures run by code and year
Thirdly, from the end of October, eight additional all-weather fixtures in weekday twilight sessions were staged due to the high volume of eliminations as large numbers of horses looked for additional opportunities at the end of the Flat turf season.
This proactive approach to maintainning the sport’s profile during severe weather and providing extra opporutnities in periods of high demand meant that despite the largest number of abandoments since 2012, the sport staged more races than ever. This, coupled with the introduction of the Appearance Money Scheme which paid out over £5.7million in additional payments directed to the grassroots of British racing, meant that total prizemoney for races run in Great Britain last year exceeded £166 million for the first time. This was a 16.5% annual increase in total prizemoney compared to 2017.
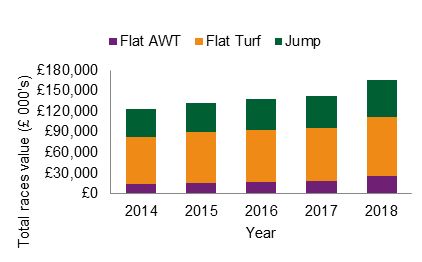
Total race values split by code and year
The inclement weather coupled with a larger volume of racing put average field sizes under pressure from the start of year. Jump racing was heavily affected during the first few months of the year but field sizes bounced back creditably to ultimately be in line with 2016 levels. Overall, for Jump racing, they responded well after a moderate year in 2017. Flat racing maintained an average field size above 9.00, posting the second-best figure in the last 5 years but marginally behind 2017 levels.
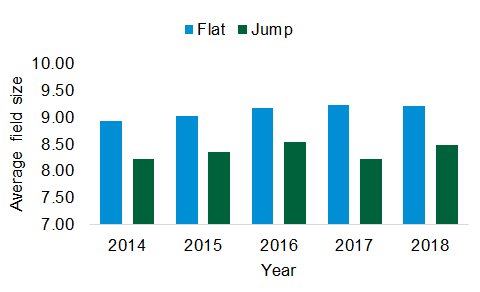
Average field sizes by code and year
One of the main reasons that field sizes have held up relatively well is that British racing continues to grow the base of individual runners. This is hugely significant for the sport and endorses the popularity of owning thoroughbreds. Having gone through a substantial decline following the financial crisis, individual runners bottomed out in 2014 but have now seen four consecutive years of growth.
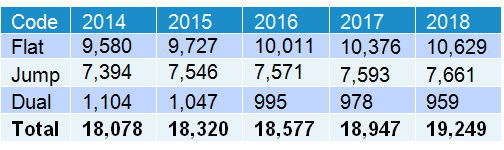
Total individual runners by code and year
Encouragingly, individual runners are growing across both codes of racing, although there has been a small decline in dual purpose horses. Individual runners are a key metric to understanding the wider health of the sport and looking forwards to future field sizes.
Complimenting the individual runner data are the total number of horses in training, which continued a recent trend of growth. As the wider industry processes become more digitised, the BHA are able to delve further into the racing population and understand the trends of the racing population. In 2018, there were almost 24,000 horses engaged in training stables across the country, again the highest since pre-2014.
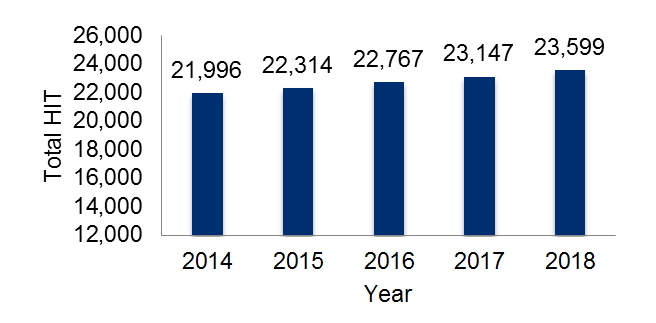
Total horses in training by year
Whilst the individual runners and horses in training numbers explain impacts to average field sizes, a further development may also have had an effect in sustaining field sizes. Last year saw the first full year of races since measures were introduced to curb non-runners. These included publishing individual trainers’ non-runners rates and if exceeding a threshold percentage of their runners, removing the ability to self-certificate their own non-runners for twelve months.
Non-runners have declined significantly during the past year. This was markedly true of Flat turf racing which saw the largest fall. By measuring the number of non-runners per Flat race, there was a drop from 0.95 non-runners per race in 2017 to 0.72 non-runners in 2018, a decrease of almost a quarter (24.2%).
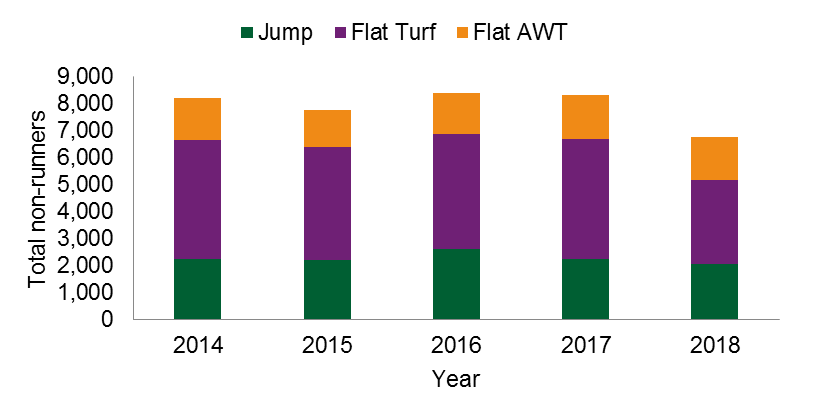
Total non-runners by code and year
All in all, many of the metrics suggest that, despite the weather, the sport delivered a solid performance in 2018. Flat racing enjoyed a period of consolidation following recent years of growth and Jump racing returned to previous levels following a below par 2017. In fact, some of the Jump data provides grounds for optimism that Jump racing may be in a position to improve its recent performance history, with growth in horses in training and individual runners. Of course, time will tell, and this fortune tellers’ caveat is that this interpretation, is set against an ever-changing backdrop within the sport which faces tough challenges in 2019 due to the on-going funding landscape and good old-fashioned British weather.