An Update on the BHA’s Jumps Handicapping Review

Dominic Gardiner-Hill
Background
In September of 2021 the BHA published the recommendations from an internal review of its Jumps Handicapping processes, instigated as a result of the standard post–Cheltenham Festival/Aintree reviews and to run alongside, although not part of, the Quality Jump Racing Review Group was formed around the same time.
While results in the Cheltenham handicaps last year were disappointing from a British perspective, a detailed statistical analysis highlighted an area within the ratings files that went beyond a basic Britain v Ireland issue – one in which we could improve our work and provide a better product for British jumps racing year round.
One of the main areas of study was the distribution of ratings across both the Hurdle and Chase files in comparison with the equivalent combined data from the three seasons running from 2008 through to 2011. It was clear to see from the graphs below that there had been a change in distribution within areas of both files – in short, there had been an upward movement of the horses located in the middle part of the files, causing the ‘bulge’ to move higher up the ratings scale.
This largely represents the area in which the younger, progressive horses who are working their way up the ratings file converge with the older, regressive horses who are starting to make their way in the opposite direction.
After discussions within the BHA handicapping team and other involved parties, a decision was taken to address this issue using an organic, ongoing process based on the analysis provided – the objective being to get the file distribution back, as much as possible, to where it was during the 2008-2011 period.
While it was made clear that there would be no seismic change in handicapping methodology, the following actions were agreed upon:
- More generous drops where appropriate for older/regressive/non-winning horses;
- Start certain sections of the novice hurdle cohort on lower opening marks;
- Recalculate BHA Race Standards (i.e. the use of past performances in a race to help rate the latest race) where appropriate;
- Remove horses from the ratings file who have not run for six months rather than nine months, allowing the handicapper to assess their marks when entered again;
- More rigorous and regular back handicapping (i.e. adjusting the ratings from past races based on the latest form).
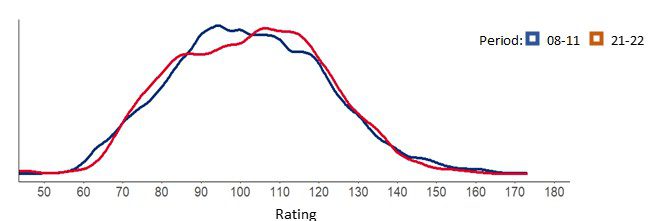
Hurdle File Distribution
The first graph highlights the shift in shape from the original analysis, while the second highlights the current comparison following a period of five months of applying the new protocols to the hurdle file. In essence, the objective of moving the ratings distribution back to historical levels has largely been met.
Hurdle Ratings Distribution Change:
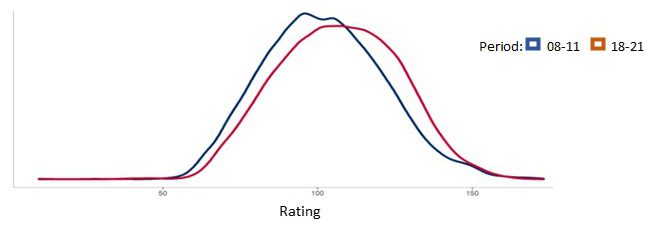
Hurdle Ratings Distribution Change:
Chase File Distribution
Frustratingly, the chase file has proved more stubborn to move. Again, the first graph represents the original analysis and the second highlights the current comparison.
- Chase Ratings Distribution Change:
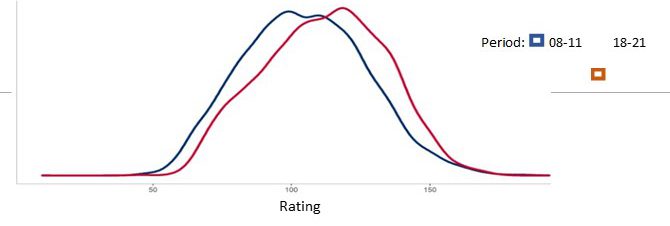
- Chase Ratings Distribution Change:
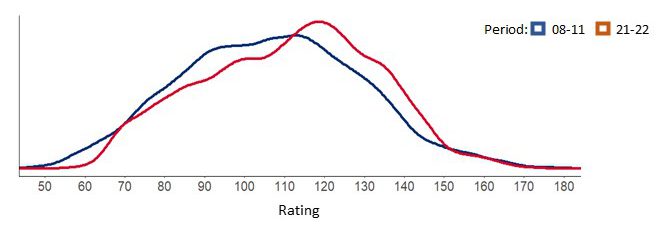
As can happen during an ongoing process, certain factors have hampered progress with the chase file. Specifically, a decrease in Chase handicap field sizes coupled with an increase of non-finishers in the same area has meant fewer opportunities to reassess horses.
Qualification for chase mark
Another factor that is likely to have impacted this process is a fundamental difference between the make up of the chase file compared to the hurdle file. Unlike the hurdle file where horses must run a required number of times to qualify for a handicap mark, horses carry their hurdle mark into the chase file, resulting in a regular injection of new marks for horses that have yet to prove their level of ability over fences. From May 1 of 2020 to January 31 2021 a total of 749 horses carried their hurdle mark into the chase file and there are currently 2,276 horses with a rating within that file, and with less evidence of the ability of many of these horses in their new discipline, adjusting their rating is a less straightforward task.
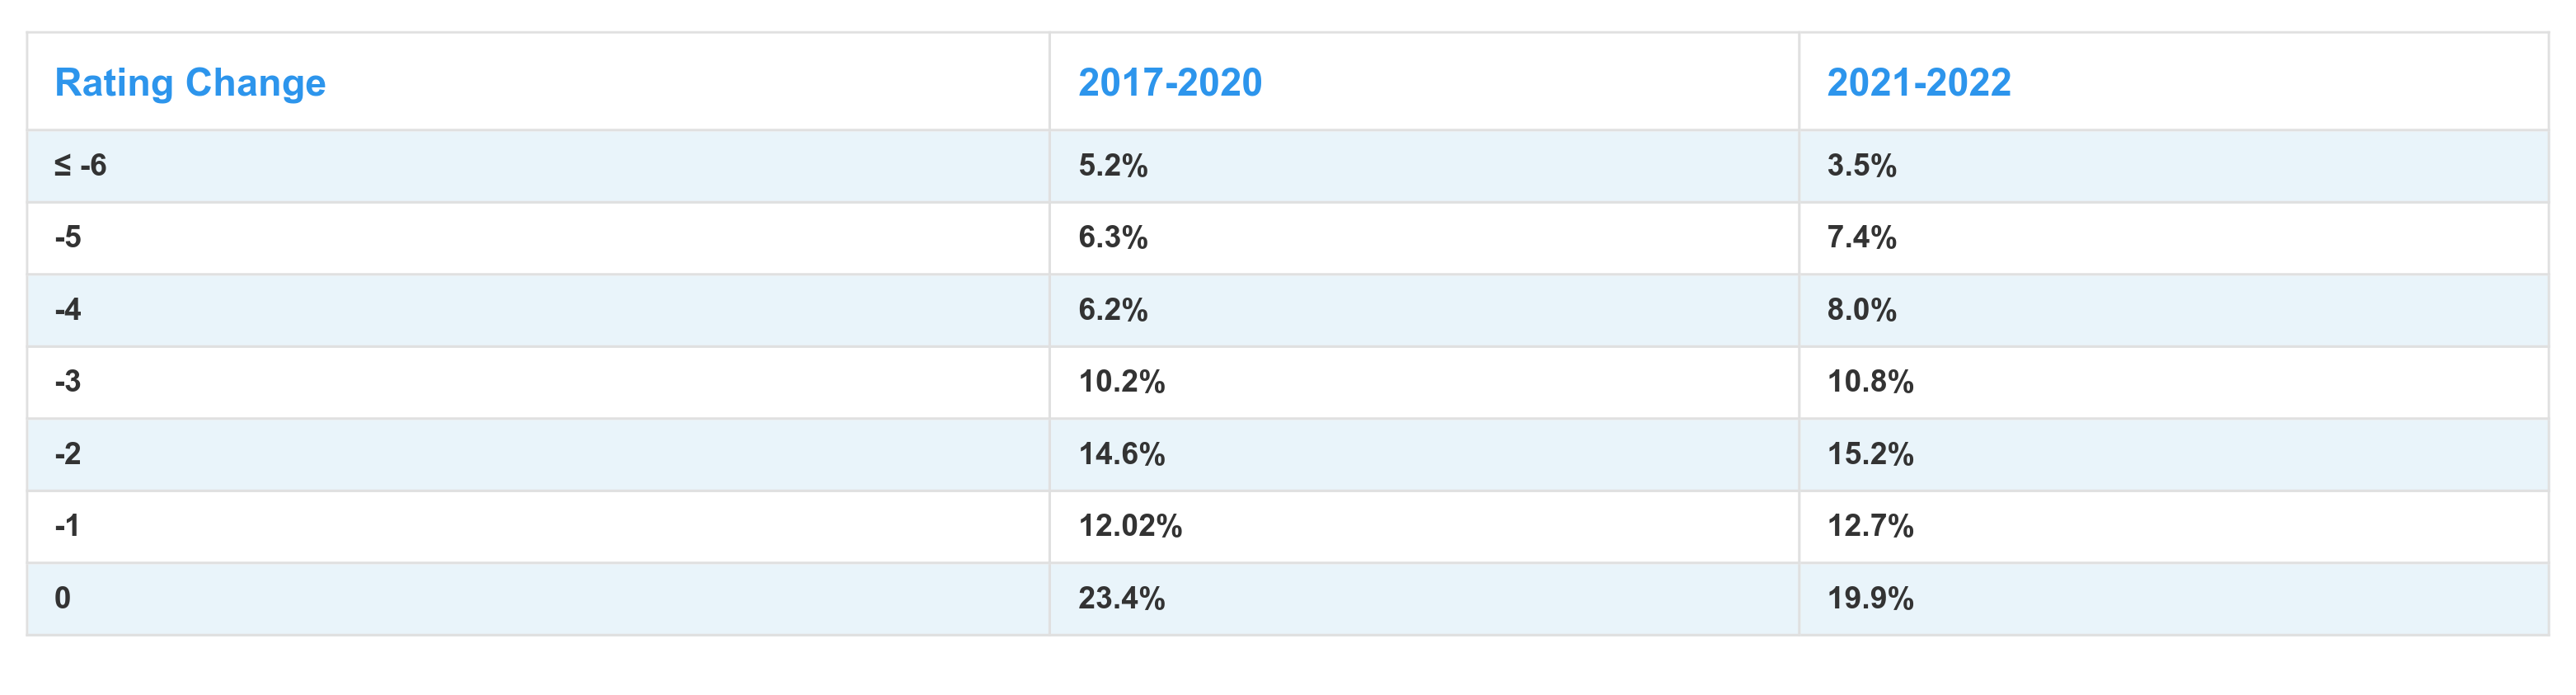
Project Effect Statistics
Despite the slower progress with the chase file, there have still been positive changes to the handicapping of jumps races during the initial review period (May 2021 – 31st Jan 2022) and the following comparisons with the last 3 complete jumps seasons (2017-2020) combined, using the same time period involved (May to following January) highlight this.
% of Runners by Individual Rating Change:
% of Runners Being Dropped:
Average ratings rise for handicap winners:


Average Ratings Change for Horses Placed 2nd, 3rd or 4th in a Handicap:
| 2017-20 | 2021-22 | |||
| Hurdle | 2nd | +2.010 | +1.200 | Decreased rise of 0.81lb |
| 3rd | -0.239 | -0.727 | Increased drop of 0.488lb | |
| 4th | -1.360 | -1.710 | Increased drop of 0.35lb | |
| Chase | 2nd | +1.280 | +0.766 | Decreased rise of 0.514lb |
| 3rd | -0.918 | -1.170 | Increased drop of 0.252lb | |
| 4th | -1.890 | -2.130 | Increased drop of 0.24lb | |
| Overall | 2nd | +1.650 | +0.766 | Decreased rise of 0.884lb |
| 3rd | -0.575 | -0.954 | Increased drop of 0.379lb | |
| 4th | -1.620 | -1.920 | Increased drop of 0.300lb |
The four tables above clearly show that winners and runners-up have been raised by less and third and fourth placed horses have been dropped by greater amounts during the period under review.
Median Opening Handicaps Marks of Novice Hurdlers
2017-20 = 108
2021-22 = 103
We have seen a very clear drop in the median of the first published marks of novice hurdlers, which has seen them increase their win impact value (where a figure of 1 is the ideal) slightly from 1.08 to 1.15 and their place impact value from 1.02 to 1.05.
Percentage Success Rates of “Outsiders”
For the purposes of these figures an outsider is any horse which went off at 25-1 or longer in a handicap. There are a number of reasons why a horse might go off at such a price, with its handicap mark probably one of the least important variables when compared to others such as current form, fitness, profile, age, trip, ground requirements, class of race and stable form but initial evidence from the period under review does suggest that the changes made by the handicappers have increased the chances (albeit by small amounts) of an outsider winning any given handicap
| 17-20 | 21-22 | ||
| Hurdle | 1.67% | 2.87% | 71.86% increase |
| Chase | 0.76% | 1.54% | 102.63% increase |
| Overall | 1.23% | 2.20% | 78.89% increase |
GB v Irish Runners in Handicaps
Whilst the purpose of the handicapping review was not about a comparison between British and Irish runners at Cheltenham, it is worth looking at the analysis of each country’s performance in handicaps where both have had runners. So that a like for like comparison can be made across the corresponding periods of the last three complete jumps seasons, we have only used Class 4 handicaps and higher for the purposes of these figures. It should also be pointed out that in the case of the Irish for 20-21 the data pool is limited at this stage.
| 2017-20 | 2021-22 | ||
| Hurdle | GB | 249-2790 (SR = 8.92%: IV = 0.96) | 55-524 (SR = 10.50%: IV = 1.03) |
| IRE | 55-414 (SR = 13.29%: IV = 1.28) | 11-112 (SR = 9.82%: IV = 0.89) | |
| Chase | GB | 160-1534 (SR = 10.43%: IV = 1.00) | 34-309 (SR = 11.00%: IV = 1.04) |
| IRE | 32-269 (SR = 11.90%: IV = 1.00) | 7-74 (SR = 9.46%: IV = 0.84) | |
| Overall | GB | 409-4324 (SR = 9.46%: IV = 0.97) | 89-833 (SR = 10.68%: IV = 1.03) |
| IRE | 87-683 (SR = 12.74%: IV = 1.16) | 18-186 (SR = 9.68%: IV = 0.87) |
Conclusions
Although the work that the handicappers have done so far has been well received by owners, trainers and other industry professionals, there is still more work to do.
Whilst the success in getting the hurdle file back into something very close to the required shape is satisfying, the stubbornness of the chase file to move the required amount is a frustration but, as the analysis above highlights, there are still improvements to be seen. Certain factors have conspired against us but the desired results will come in time as this work continues.
It is understandable that many will view handicap results at next month’s Cheltenham Festival as the testing ground for this piece of work but it is important to stress once again that this project aims to improve the handicapping product for British racing year round.
The next stage will be to conduct end of season analyses which will be even more informative than, these interim figures, allowing us to compare entire season statistics. We will also be able to carry out more detailed analysis on novice hurdlers through entire seasons, allowing all those horses that migrated a hurdle mark into the chase file more time to be given mark a mark that represents their chase form rather than their hurdle form.
Until then, we will continue to strive to provide the best and fairest product we can.