We calculate a performance figure for every horse in every race.
This is the rating we think each horse has achieved in a particular race, given a variety of factors, and are expressed on an identical scale to handicap ratings.
When deciding on a performance figure, we watch every race multiple times in order to understand why the result turned out that way. The literal result of a race tells you only how things stood as the horses crossed the line.
We take into account everything we know about each of the runners and the specifics of the race (the racecourse, the distance, the ground, the draw, the relative weights carried, the tempo at which it was run, etc.) plus more interpretative factors such as whether a horse has started slowly, raced greenly (showing signs of inexperience) or been hampered/eased. To further illuminate this analysis, we also use a number of handicapping tools.
We retain performance figures for each run of every horse’s career. This profiles what we think a horse has been achieving and how they are performing in comparison to their handicap rating.

Calculating a performance figure
The starting point when setting out to produce a set of performance figures for any given race is previous form (i.e. performances) and then using the appropriate lb/length calculation to determine the relativity between the competing horses, taking into account the weights carried. It is important to note that apprentice allowances are always added back on to the weight carried when producing performance figures.
For example, in its simplest form:
1m Maiden (3yo only – all carry 9st) (good to firm ground) : 1 length = 2lbs
1st Alpha previous performances = 78
2nd 1L Beta previous performances = 80-78
3rd 0.5L Charlie previous performances = 79-79
4th 0.5L Delta previous performances = 78
The handicapper’s task is to best match the previous performances against this most recent piece of form and, using that earlier evidence as a basis, calculate the level to which each has performed.
In this particular example their job is relatively easy.
Using the appropriate calculation of 2lb/length, the basic relativities between the four horses would be:
1st Alpha 0
2nd Beta -2 (1L x 2lb)
3rd Charlie -3 (1L x 2lb + 0.5L x 2lb)
4th Delta -4 (1L x 2lb + 0.5L x 2lb + 0.5L x 2lb)
These figures reflect the fact that Alpha is 2lb superior to Beta in this race, who in turn is 1lb superior to Charlie who in turn is 1lb better than Delta.
When compared to the previous performance figures, the level for this contest is easily achieved as those are the relativities that were expected.
1st Alpha PF = 82 (+4 on previous run)
2nd 1L Beta PF = 80 (equal to previous run)
3rd 0.5L Charlie PF = 79 (equal to previous 2 starts)
4th 0.5L Delta PF = 78 (equal to previous start)
Had Alpha run out an easy winner of this race and the handicapper felt he could have won by a greater margin then they will take that into account. If the belief is that Alpha could have won the race by 2.5 lengths instead of 1 length then the relativity between Alpha and Beta will be assessed at 5lb (2.5L x 2lb) rather than 2lb and Alpha’s performance figure would be 85 (Beta at 80 +5lb) rather than 82.
Life, of course, is very rarely that simple and, unlike the above example, the majority of races feature horses carrying different weights and that has to be factored in when calculating performance figures.
Another simple example where Bravo (2nd) and Delta (4th) are fillies and are receiving the 5lb allowance (ie carrying 5lb less than the colts) which is taken into account when producing performance figures
1st Alpha (carrying 9.07) previous performances = 77
2nd 2.5L Beta (carrying 9.02) previous performances = 70-70
3rd 0.5L Charlie (carrying 9.07) previous performances = 76-75
4th 1L Delta (carrying 9.02) previous performances = 73
Once again using 2lb/length as the appropriate calculation, the basic relativities between the horses would be:
1st Alpha 0
2nd Beta -10 (2.5L x 2lb + 5lb)
3rd Charlie -6 (2.5L x 2lb + 0.5L x 2lb)
4th Delta -13 (2.5L x 2lb + 0.5L x 2lb + 1L x 2lb + 5lb)
In this example the figures don’t quite fit as neatly as expected (the case in the vast majority of races) and the skill of the handicapper, using their knowledge, experience, analysis of the strength of previous performance, ground conditions, trip and tools such as race standards and speed figures to decide the appropriate level.
Had time analysis shown the race to be run at a largely steady pace, therefore allowing the less talented horses to finish closer to the potentially better horses then the handicapper may take a lower view of the form, returning figures along the lines of:
1st Alpha PF = 80 (+3lb on previous performance)
2nd Beta PF = 70 (equal to 2 previous starts)
3rd Charlie PF = 74 (-2 and -1 on previous starts)
4th Delta PF = 67 (-6 on previous performance
Had speed figures shown the race to be run at a strong pace, and therefore a more reliable guide to the relative ability of the horses, the handicapper would take a more positive view of the form – along the lines of:
1st Alpha PF = 82 (+5lb on previous start)
2nd Beta PF = 72 (+2lb on previous start)
3rd Charlie PF = 76 (equal to previous run)
4th Delta PF = 69 (-4lb to previous start)
If those were the chosen figures for the race, then the handicapper would then double check whether, in the light of these subsequent performances, the levels of Alpha and Beta’s previous races needed to be raised a little or whether the level of Delta’s previous race needed to be dropped a little.
A further level of complexity is added to the calculation of performance figures when horses of different ages meet and there is a weight for age allowance involved.
The theory behind this allowance is explained elsewhere in the guide but it is basically an allowance to make up for physical (and sometimes mental) immaturity in younger horses.
Once again using the previous basic examples but this time with all four horses being colts but with Charlie (3rd) being a 4yo running against 3yo’s at a time of year when the weight allowance is 8lb over a mile:
1st Alpha (3yo: carrying 8-13)
2nd 1.5L Delta (3yo: carrying 8-13)
3rd 1.5L Charlie (4yo: carrying 9-07)
4th 0.5L Delta (3yo: carrying 8.13)
Although Charlie (3rd) is physically carrying 8lb more on his back, because he is a year older and therefore more mature and possibly stronger than his younger rivals it is considered that they are running at the equivalent of level weights.
Therefore the relativities are:
1st Alpha 0
2nd Delta -3 (1.5L x 2)
3rd Charlie -6 (1.5L x 2 + 1.5L x 2)
4th Delta -7 (1.5L x 2 + 1.5L x 2 + 0.5L x 2)
The simplest way to “equalise” the weight for age factor is to add the given allowance back onto the weight of the 3yo, as such
1st Alpha (3yo) 8-13 + 8lb wfa = 9-07
2nd Beta (3yo) 8-13 + 8lb wfa = 9-07
3rd Charlie (4yo) 9-07 + 0lb wfa = 9-07
4th Delta (3yo) 8-13 + 8lb wfa = 9-07
There will be occasions when there is very limited or, in some cases, no previous performances to use as a basis for producing performance figures. In these cases the handicapper would look at other areas as a guide – time comparisons with other races on the same card (particularly over the same distance) and race standards.
Explained elsewhere, the latter gives an historical perspective involving previous runnings of the race and suggests what level of performance is normally required to win or be placed in any given race. These can then be used as “holding figures” until subsequent racecourse form becomes available and can be fed back into the original result to get a more accurate level on the contest.
Lack of evidence is rarely a problem in producing performance figures for handicaps and the process remains the same – finding the relativity at a certain level using weight carried and a lb/calculation.
Once again, a simple example:
1st Alpha (carrying 9-02, BHA rating of 85) – previous PF = 85-85-82
2nd 0.5L Beta (carrying 9-05, BHA rating of 88) – previous PF = 88-82-87
3rd 1L Charlie (carrying 9-02, BHA rating off 85) – previous PF = 83-85-85
4th shd Delta (carrying 9-00, BHA rating of 83) – previous PF = 80-83-83
The relativities between them are therefore:
1st Alpha 0
2nd Beta +2 (0.5L x 2 – 3lb)
3rd Charlie -3 (0.5L x 2 + 1L x 2 + 0lb)
4th Delta -5 (0.5L x 2 + 1L x 2 + 2lb)
So, given this result Alpha, although winning, is 2lb inferior to Beta because of the relative weights carried, whilst Beta is a total if 5lb superior to Charlie, who in turn is 2lb superior to Delta.
The performance figures and resulting handicaps marks for this result would likely be:
1st Alpha PF = 88 New BHA rating = 88 (+3)
2nd Beta PF = 90 New BHA rating = 90 (+2)
3rd Charlie PF = 85 BHA rating remains 85
4th Delta PF = 83 BHA rating remains 83
The upshot being that, should these 4 horses meet in another handicap in the near future, Charlie (3rd) and Delta (4th) would 3lb “better off” with Alpha (winner) and 2lb “better off” with Beta (2nd), whilst Beta would be 1lb “better off” with Alpha. In theory giving all 4 an equal chance of winning that future handicap.
The examples given above are a simplistic demonstration of how performance figures are calculated. The pounds per length calculation will change depending on the distance of the race, at 5 furlongs on good to firm ground the calculation will be 3.41 lb/length whilst at 1m 6f under similar conditions it will be 1.22 lb/length. The basic process of calculation remains the same however.
Only after you have completed the performance figures do you even consider whether a horse may now qualify for a handicap mark or whether its existing handicap rating requires adjustment.
Why do we add back allowances?
A jockey’s allowance is an acknowledgement that they are not yet as skilled a race-rider as an experienced professional.
From a handicapping perspective, there are two reasons why we always reintroduce the weight of the allowance into our calculations.
Firstly, taken as a whole, allowances do not give claiming jockeys an advantage. Inexperienced riders receive an allowance because they need them.
Second, we do not know who will be riding the horse next time. Say we treat a 70-rated horse ridden by an apprentice claiming 5lb as if it were a 65-rated horse. Next time, should the same apprentice ride it again off 65, we would have to consider it as a 60-rated horse. This would be plainly incorrect and place that horse’s future opposition at a disadvantage.
Poundage scales
Handicapping brings together horses of varying ability to give each a comparable chance in the same race by the application of different weights to carry. So if one horse finishes a length in front of another, by how much do we have to vary the weights in order to bring them together?
Many things affect this calculation. The distance of the race is important. The longer you have to carry a weight, the greater its effect on your performance. Whether the ground is fast or soft also impacts on performance. We also take into account the pace of the race, the nature of the racecourse and other factors.
Therefore we do not use the same poundage scale for, say, a top class 5f race as for, say, the Grand National over 4m2f. The longer that a horse has to carry weight, the more it will slow it down.
The following graphs give an approximate guide to the poundage scale we would use for Flat and Jumps handicapping. They show typical values for pounds per length and represent the change in weight that would equalise performance between two horses finishing one length apart.
It is important to understand that these pounds per length are solely an average at each distance. Within each distance, the poundage will then vary depending on overall time, going and the finishing speed of the principals.
For example, the Flat graph at 5f equates to what we would normally use (3.4lbs) based on a race run on good going over 60 seconds. However, if a race was run over 5f in 55 seconds at a sharp track like Epsom on good to firm going, our scale suggests it should be closer to 4lbs per length. A 5f race run in 65 seconds at a stiff track like Pontefract on soft going would be more like to 3lbs per length.
This detailed process is replicated across the whole scale of distances, on both Flat and Jump racing.
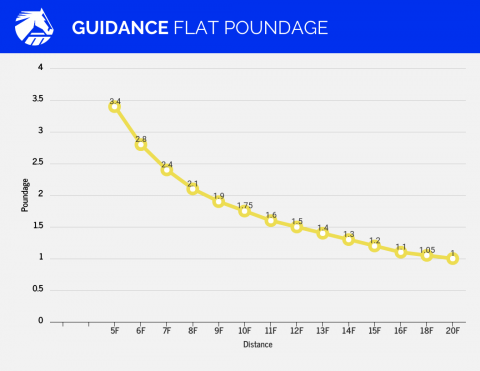
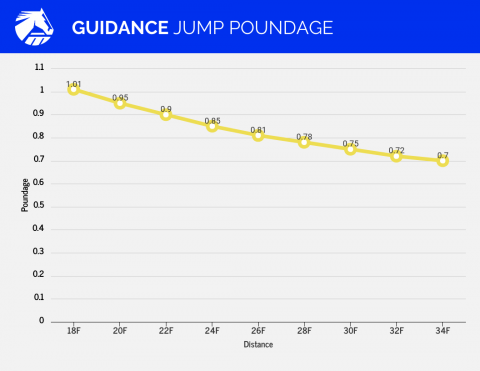
As the graphs show, the Flat poundage scale ranges more markedly than its Jumps equivalent and is also far from a straight line.
The subject of poundage is complex and open to much interpretation. The BHA monitors its handicapping data continuously to produce the fairest poundage scales.
Why we don’t use the literal result
The race result only tells us the relative positions of the runners as they crossed the finishing line. This almost always tells us only part of the story about what the form of each horse is worth.
Take Sir Pass I Am as an example. The result says the winner finished a neck in front of the second but that is nothing like a fair reflection of their actual merit.
Watch the final stages of the race below:
Footage courtesy of At The Races.