May field sizes and focus on non-runner rates

The latest monthly data pack shows similar field size figures up to the end of May to that of the same period in 2014, writes Antonia Newman.
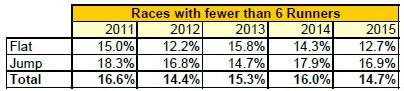
Encouragingly, failure rates (races run with fewer than six runners) have decreased from 16% in 2014 to 14.7% so far this year, with the biggest improvements shown on the Flat, which has decreased from 14.3% to 12.7% up to the end of May. Nonetheless, it’s fair to say that the gains in field sizes have slowed since the beginning of the year when BHA implemented race restriction measures to address historically poor field sizes over Jumps and on the All Weather between January and March (a designated ‘pinch point’). At the end of March, field sizes were up by 2% overall (from 8.20 in 2014 to 8.39 in 2015) and it’s disappointing that this trend has not continued through April and May.
Jump racing in particular seems to have struggled as we move into the early summer months. Field sizes in May over Jumps are 1.9% lower than during the same month last year (at 8.23 vs. 8.39). Last month, as covered by the April blog, field sizes in 2yo races on the Flat were also down, although it’s pleasing to see these are now improving slightly with an average field size of 8.4 in May 2015 over 7.9 in the same month last year.
The BHA will continue to monitor field sizes as the Flat and summer Jumping programmes progress. If anything, the field sizes in April and May are a timely reminder that the interventions made during the earlier ‘pinch point’ were not only necessary, but also successful at improving field sizes and success rates.
Focus on non-runners
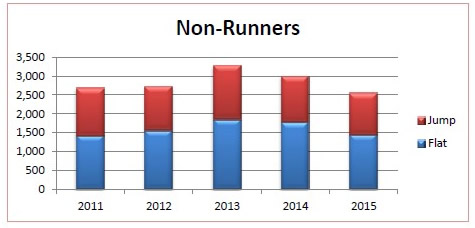
Focusing specifically on non-runners, it’s pleasing to see that we have seen a continuous decline in the number of non-runners for the first five months of the year. These figures are down from 3,259 in 2013 to 2,983 in 2014 and 2,545 this year – a reduction of 21.9%. The average number of non-runners per race has also reduced by 0.18 (down by 21.5%).
You could argue this is in part due to there being fewer races run, however the fact that the average number of non-runners per race has also decreased counters this suggestion.
There could be various reasons for these reduced rates over the first five months in 2015. Better Going conditions could be one reason, considering that fewer races have been run on soft or heavy Going in 2015 so far. It is worth pointing out though that Going equates to 35% of total non-runners, which is consistent with the statistics from the last two years. We believe therefore that changes in trainer behaviour due to the BHA’s monitoring of self-cert thresholds, and subsequent removal of that right where trainers exceed the threshold, has had some impact on the reduction in non-runners to date. The use of self-certs has reduced from approximately 41% of non-runner certificates in the last two years to 37% this year.
Download the Data Pack
The latest monthly data pack covering the period from 1 January to 31 May can be downloaded here: https://www.britishhorseracing.com/wp-content/uploads/2015/04/May-2015-Stats-pack.pdf