Positive signs across Racing’s key data, but more to be done
Today British Racing’s 2015 “Datapack” has been published, which analyses the performance of many of Racing’s Key Performance Indicators in 2015 compared to previous years. Paul Johnson, Head of Racing for the British Horseracing Authority (BHA) blogs about some of the standout elements from that data.
The data we have published today confirms the impression we had been building throughout the year, which has been one of an encouraging reversal in trends when it came to Racing’s core statistics.
This is the data around field sizes, competitiveness of racing and the numbers of horses in training – important measures of the success of the sport. For a number of years we have been witnessing a trend towards decline pretty much across the board, but in 2015 we have seen those trends reversed and growth witnessed in almost every area. While the growth figures themselves are relatively modest, the reversal of the trend towards decline is, in itself, an encouraging result and we are expectant of further improvement to come.
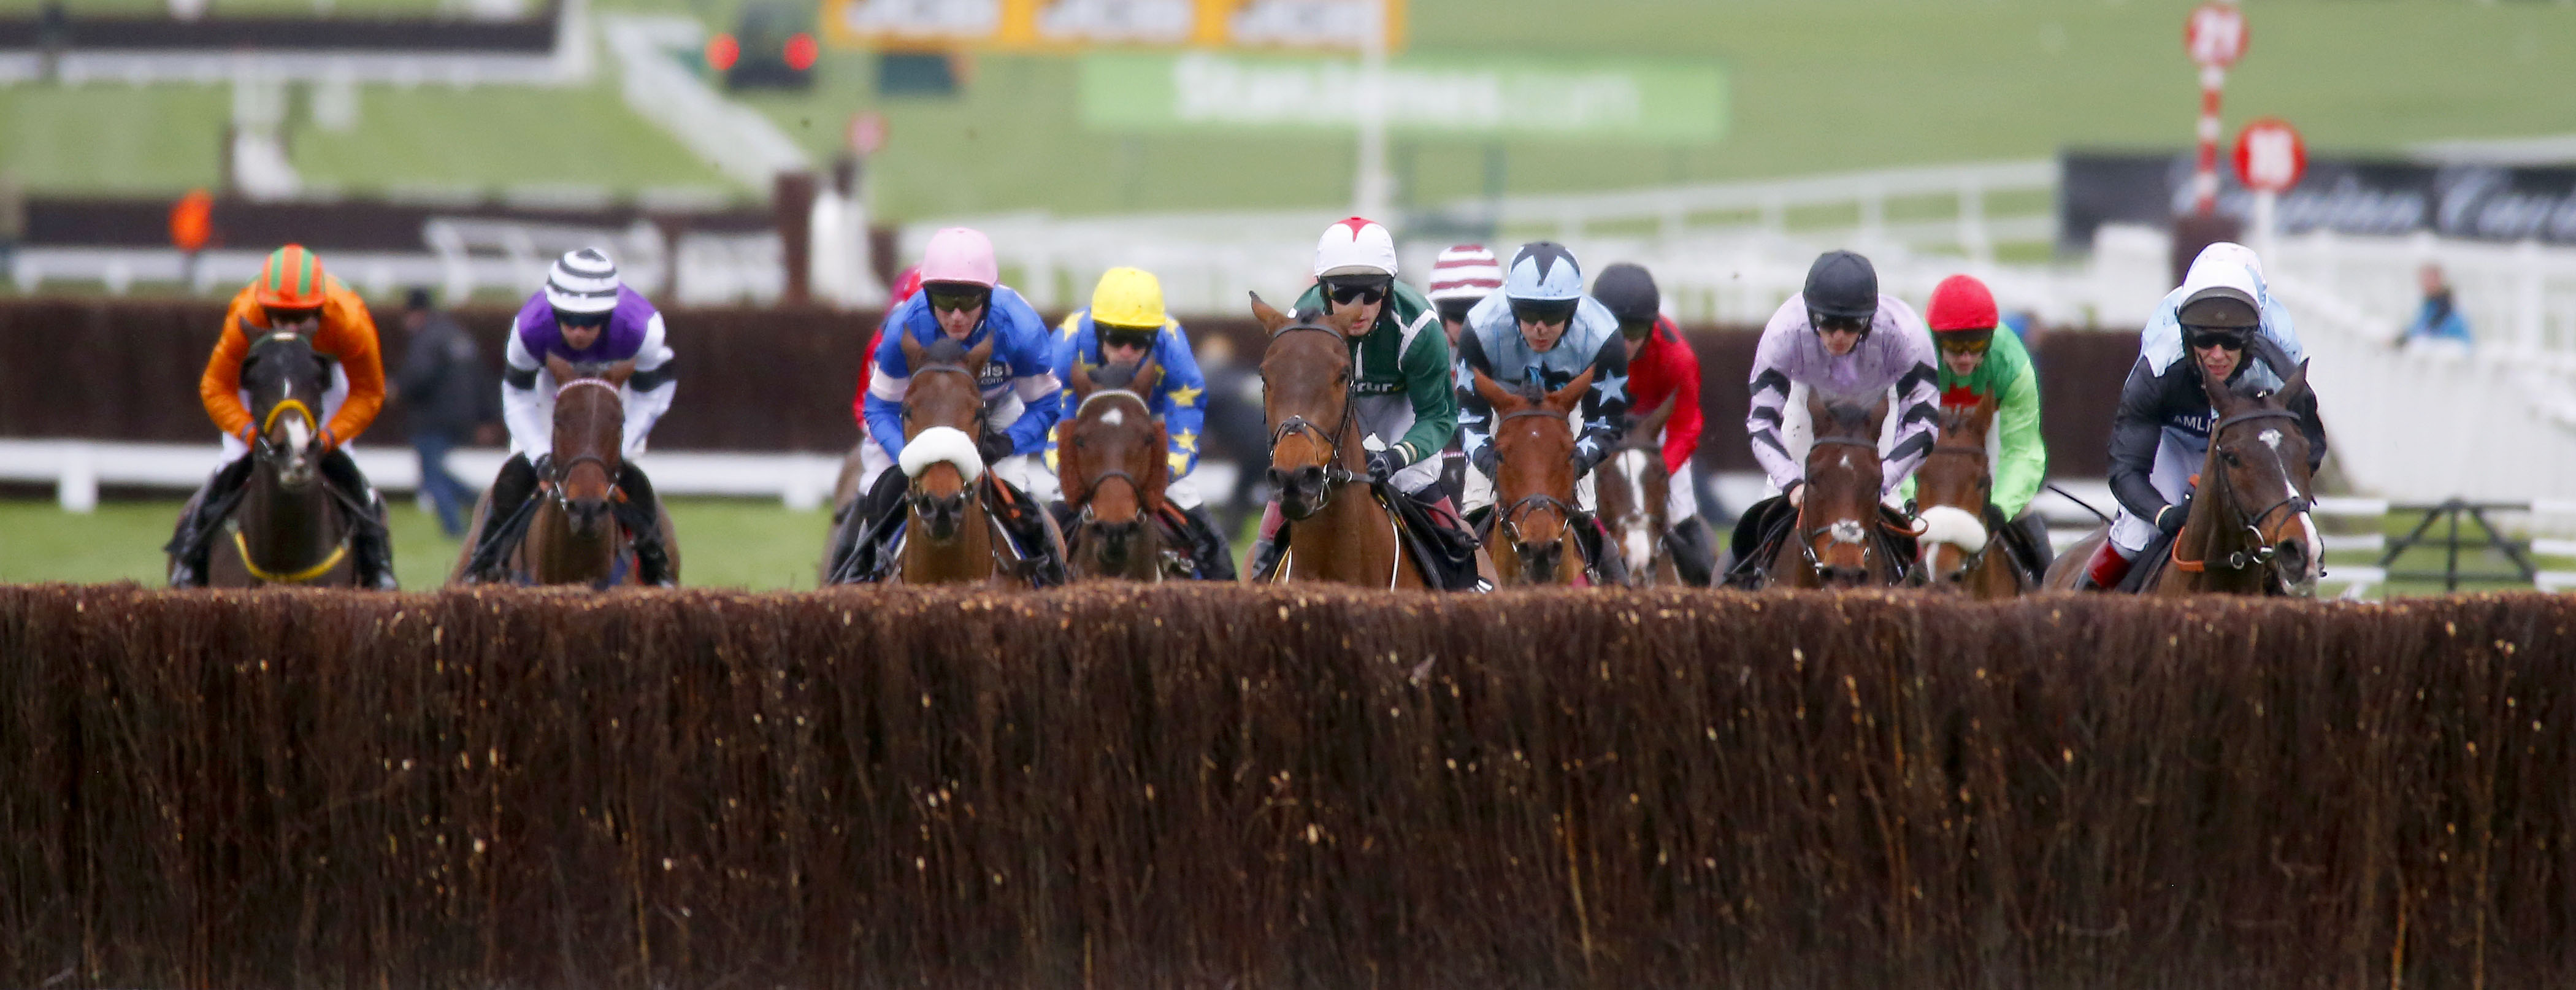
We’ll start with our ‘failure’ and ‘success’ rates – these are the races which feature fewer than six runners or more than eight runners. In both cases the stats are positive and, as the tables show, we have seen a decrease of 16% in the number of races with fewer than six runners and an increase of 4.3% in the number of races with eight or more runners.
These are important figures, they are the figures we look to ahead of average field sizes to indicate how compelling is the racing that we are providing, so it is especially pleasing to see growth in these areas.
| Races with fewer than 6 Runners | |||||
| 2011 | 2012 | 2013 | 2014 | 2015 | |
| Flat | 10.1% | 9.8% | 13.3% | 12.3% | 10.9% |
| Jump | 17.4% | 16.5% | 15.9% | 20.5% | 16.3% |
| Total | 12.9% | 12.2% | 14.3% | 15.4% | 12.9% |
| Races with 8 (or more) Runners | |||||
| 2011 | 2012 | 2013 | 2014 | 2015 | |
| Flat | 69.9% | 71.9% | 64.8% | 63.9% | 65.9% |
| Jump | 60.1% | 61.0% | 60.3% | 51.3% | 54.8% |
| Total | 66.1% | 67.9% | 63.1% | 59.2% | 61.7% |
We’ve also seen a decrease of 6.1% in the number of races which include an odds-on favourite, again an important measure of the competitiveness we are providing.
| Races with Odds On Favourites | |||||
| 2011 | 2012 | 2013 | 2014 | 2015 | |
| Flat | 13.1% | 11.2% | 13.7% | 13.7% | 12.7% |
| Jump | 19.8% | 16.9% | 17.8% | 18.6% | 17.8% |
| Total | 15.7% | 13.3% | 15.2% | 15.6% | 14.6% |
Although they are a less robust measure as the success and failure rates, we do still look at average field sizes to give us an overall indication as to how the sport is performing, and again the outlook in this area is positive with average field sizes up by 1.3% overall.
| Average Field Size | |||||
| 2011 | 2012 | 2013 | 2014 | 2015 | |
| Flat | 9.50 | 9.59 | 8.99 | 8.93 | 9.02 |
| Jump | 8.97 | 8.92 | 8.88 | 8.22 | 8.35 |
| All | 9.30 | 9.35 | 8.95 | 8.66 | 8.77 |
Notably, when drilling down into the detail, the biggest increase came in Chases, where average field sizes were up by 4%. This is especially pleasing as this is the area where, arguably, most improvement was required.
| Average Field Size (by Race Type) | |||||
| 2011 | 2012 | 2013 | 2014 | 2015 | |
| Flat | 9.50 | 9.59 | 8.99 | 8.93 | 9.02 |
| Steeple Chase | 7.25 | 7.51 | 7.53 | 7.03 | 7.31 |
| Hurdle | 9.96 | 9.76 | 9.75 | 8.86 | 8.91 |
| NHF | 10.75 | 10.09 | 9.62 | 9.28 | 9.16 |
| Hunter Chases | 8.75 | 8.65 | 8.56 | 8.97 | 9.02 |
So what are the reasons for these improvements? Alongside general macro-economic factors, we believe that they fall into two main areas.
Firstly, we believe that the race planning initiatives we put in place in 2015 have had a positive impact. Primary amongst these were the removal of races from ‘pinch point’ periods, namely Flat/Jumps in January to March and Jumps in September to November. There were simply too many races in these periods for the horse population to fill, but removing races has increased the competitiveness of those races that were run. The theory that these initiatives have been successful is supported by the fact that the largest percentage of races removed were Chases, and this is the area where we have seen the greatest growth.
However, the other significant contributory factor is an increase in the number of Horses in Training. The population has risen by 3% overall, with a 2% rise in the number of Jumpers.
Clearly this has contributed to field sizes – again, the Chase races here provide the clearest illustration of this. Despite the removal of a large number of Chases, we actually staged more Chases in 2015 than in 2014, with one of the main reasons for this being the very small number of abandoned fixtures. So, in order to produce an increase in field sizes in these races despite an increase in the number of races it is clear that more horses have been participating.
This also further reinforces the value of the initiative to remove races from the programme or we could have seen the positive effect of the increased population nullified by the greater spread of races.
| ALL HORSES IN TRAINING | |||||
| 2011 | 2012 | 2013 | 2014 | 2015 | |
| Flat | 8,634 | 8,471 | 8,440 | 8,525 | 8,715 |
| Jump | 4,542 | 4,420 | 4,452 | 4,309 | 4,397 |
| Dual | 670 | 647 | 632 | 635 | 616 |
| All | 14,055 | 13,716 | 13,703 | 13,528 | 13,886 |
We have also seen a healthy 5.3% rise in the number of two-year-olds in training, in particular the number of fillies. One contributory factor to this is likely to be the Plus 10 bonus scheme and in 2015 field size performance for all races covered by the Plus 10 scheme achieved growth. We look forward to seeing these two-year-olds develop into three-year-olds to provide a further boost to Flat field sizes next year.
| FLAT HORSES IN TRAINING | |||||
| 2011 | 2012 | 2013 | 2014 | 2015 | |
| 2yo | 3,042 | 2,849 | 2,966 | 3,044 | 3,214 |
| 3yo | 2,586 | 2,652 | 2,482 | 2,495 | 2,545 |
| 4yo | 1,264 | 1,229 | 1,230 | 1,161 | 1,174 |
| 5yo+ | 1,741 | 1,741 | 1,763 | 1,824 | 1,782 |
| Total | 8,634 | 8,471 | 8,440 | 8,525 | 8,715 |
So, a positive set of figures overall. However, we cannot get carried away. We have seen a reversal of trends towards decline, which is great news, but we’re not where we need to be. We are still well short of the figures of five years ago and it is important that we see further growth to get racing back to the levels of competition and excitement that our customers associate it with. That isn’t going to happen overnight, the sport now needs to deliver on its ambitious growth targets via the Strategy for Growth and I am aware that my colleagues are currently organising a series of Industry Update events to report back on where the sport has got to on this front in the coming weeks.
The positive data I have discussed here provides a platform for this growth, the green shoots of recovery so to speak, but clearly until the sport’s central funding issues are addressed we face dramatically increased constraints under which we can operate.
We will, however, be publishing the findings of our holistic race planning consultation in the coming weeks. I’m very positive that findings of that work can lead to the implementation of an improved approach to race planning that will benefit horsemen, racecourses and – crucially – those of us who enjoy watching the sport.
The full 2015 Datapack can be viewed here.
Details of the initiatives announced in October 2014 to address small field sizes in 2015 can be found here.